Reporting on your students' progress
Viewing a report
Section titled “Viewing a report”All report data is updated in real time.
- Go to the Reports page.
- Select a Cohort.
- Tap the type of report that you want to view.

Reports page
- Select the students that you’d like to report on.
- In the top right corner, tap .
- Tap Pick Students.
- Select individual students, or tap Select All.
Working with Evaluation Progress reports
Section titled “Working with Evaluation Progress reports”The Skill Evaluations Progress report and Patient Evaluations Progress reports have a similar format and viewing options.

Skill Evaluations Progress report
View data for a specific learning phase
Section titled “View data for a specific learning phase”Use the tabs at the bottom of the screen to view evaluation data for each learning phase.
View evaluations that counted towards a requirement
Section titled “View evaluations that counted towards a requirement”To view the specific evaluations that counted towards a requirement, tap the count in the [student’s name] column.
Filter by evaluator type
Section titled “Filter by evaluator type”- To view peer evaluations, tap Evaluated by Peer.
- To view instructor evaluations, tap Evaluated by Instructor.
Show success rates
Section titled “Show success rates”Tap Show Success Rates to show the percentage of evaluations that were successful for each requirement.
Export to Excel
Section titled “Export to Excel”In the top-right corner, tap . The file downloads to your device.
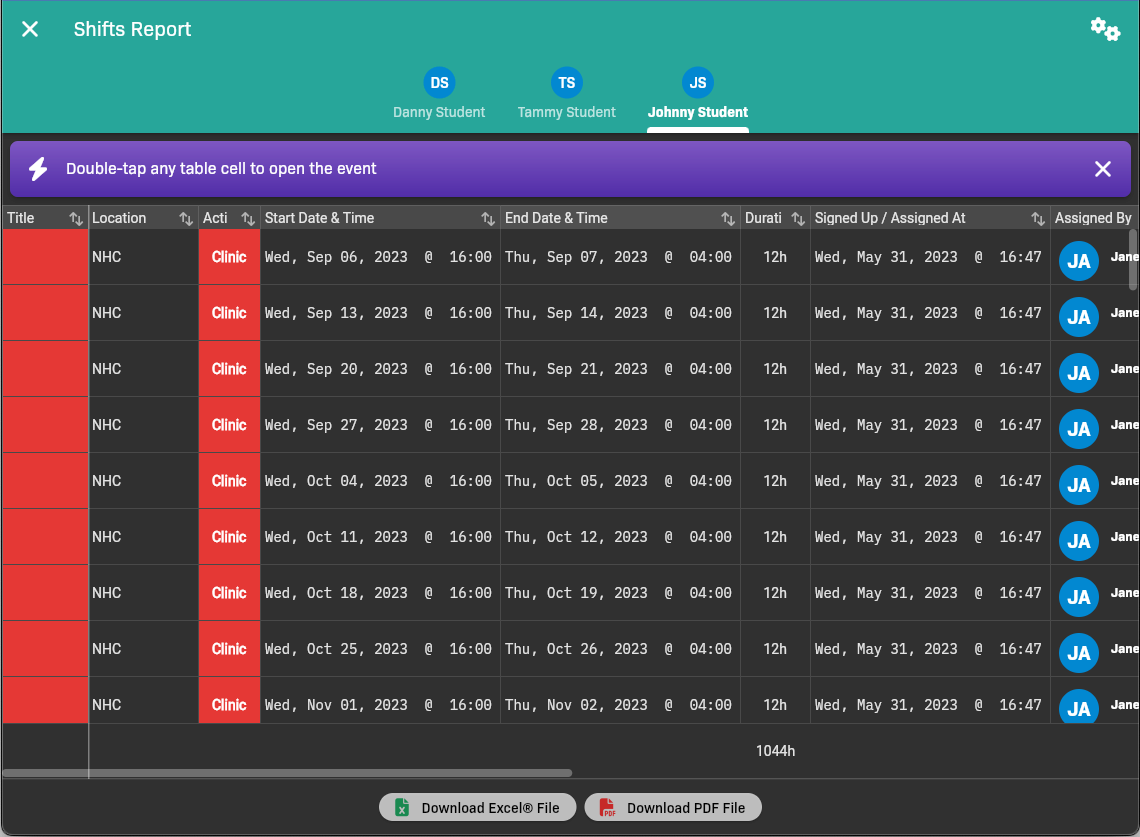
Working with the shifts report
Section titled “Working with the shifts report”The Shift Attendance report shows scheduled hours versus attended hours.
Shifts Report
Understand attendance labels
Section titled “Understand attendance labels”Attendance labels are calculated when the report is generated. EMCE does not store a separate report label on the attendance record; it compares the event’s scheduled start and end time with the student’s clock-in and clock-out punches.
| Label | What it means |
|---|---|
| Early | The student clocked in during the early clock-in window: from 30 minutes before the event start up to, but not including, the event start. |
| On-Time | The student clocked in at the event start time or within 5 minutes after the event start. |
| Late | The student clocked in more than 5 minutes after the event start. |
| Departed Early | The student clocked in and clocked out, and the clock-out time is before the event end time. |
| Departed On-Time | The student clocked in and clocked out, and the clock-out time is at or after the event end time. |
| Absent | The student was marked absent. |
| No Clock Punches | The student has no clock-in punch and no clock-out punch for the event. |
Exact boundaries matter. A clock-in exactly at the event start is On-Time. A clock-in exactly 5 minutes after the event start is still On-Time. Anything after that 5-minute mark is Late.
There is no separate Departed Late label. A student who clocks out after the scheduled end is still shown as Departed On-Time.
Students can normally clock in from 30 minutes before the scheduled start until before the scheduled end. Total hours are calculated from the elapsed minutes between clock-in and clock-out, not from the scheduled event duration.
View data for a particular student
Section titled “View data for a particular student”Use the tabs to select the student for whom you want to view shift data.
Filter the shifts report
Section titled “Filter the shifts report”You can filter shifts by Learning Activities, Start Date / Time, End Date / Time, and students.
Tap in the top-left corner of the screen to access filtering parameters.
View an event’s details
Section titled “View an event’s details”Double-tap on a row to view details for that event.
Export
Section titled “Export”Tap Download Excel File or Download PDF File to download the file to your device.
Using the Data Export to build your own reports
Section titled “Using the Data Export to build your own reports”If you need to access evaluation data that isn’t provided by one of the predefined reports, you can use the Data Export to export the needed data, then manipulate it in a spreadsheet application like Microsoft Excel.
Step 1: Export the needed data
Section titled “Step 1: Export the needed data”By default, all data in the selected cohort is exported. You have the option to filter by student, learning activities, evaluation type, and time range.
-
Go to the Reports page.
-
Select a Cohort.
-
Tap the Data Export card.
-
Tap Parameters to select the data you need to export. All filtering parameters are optional except Cohort.
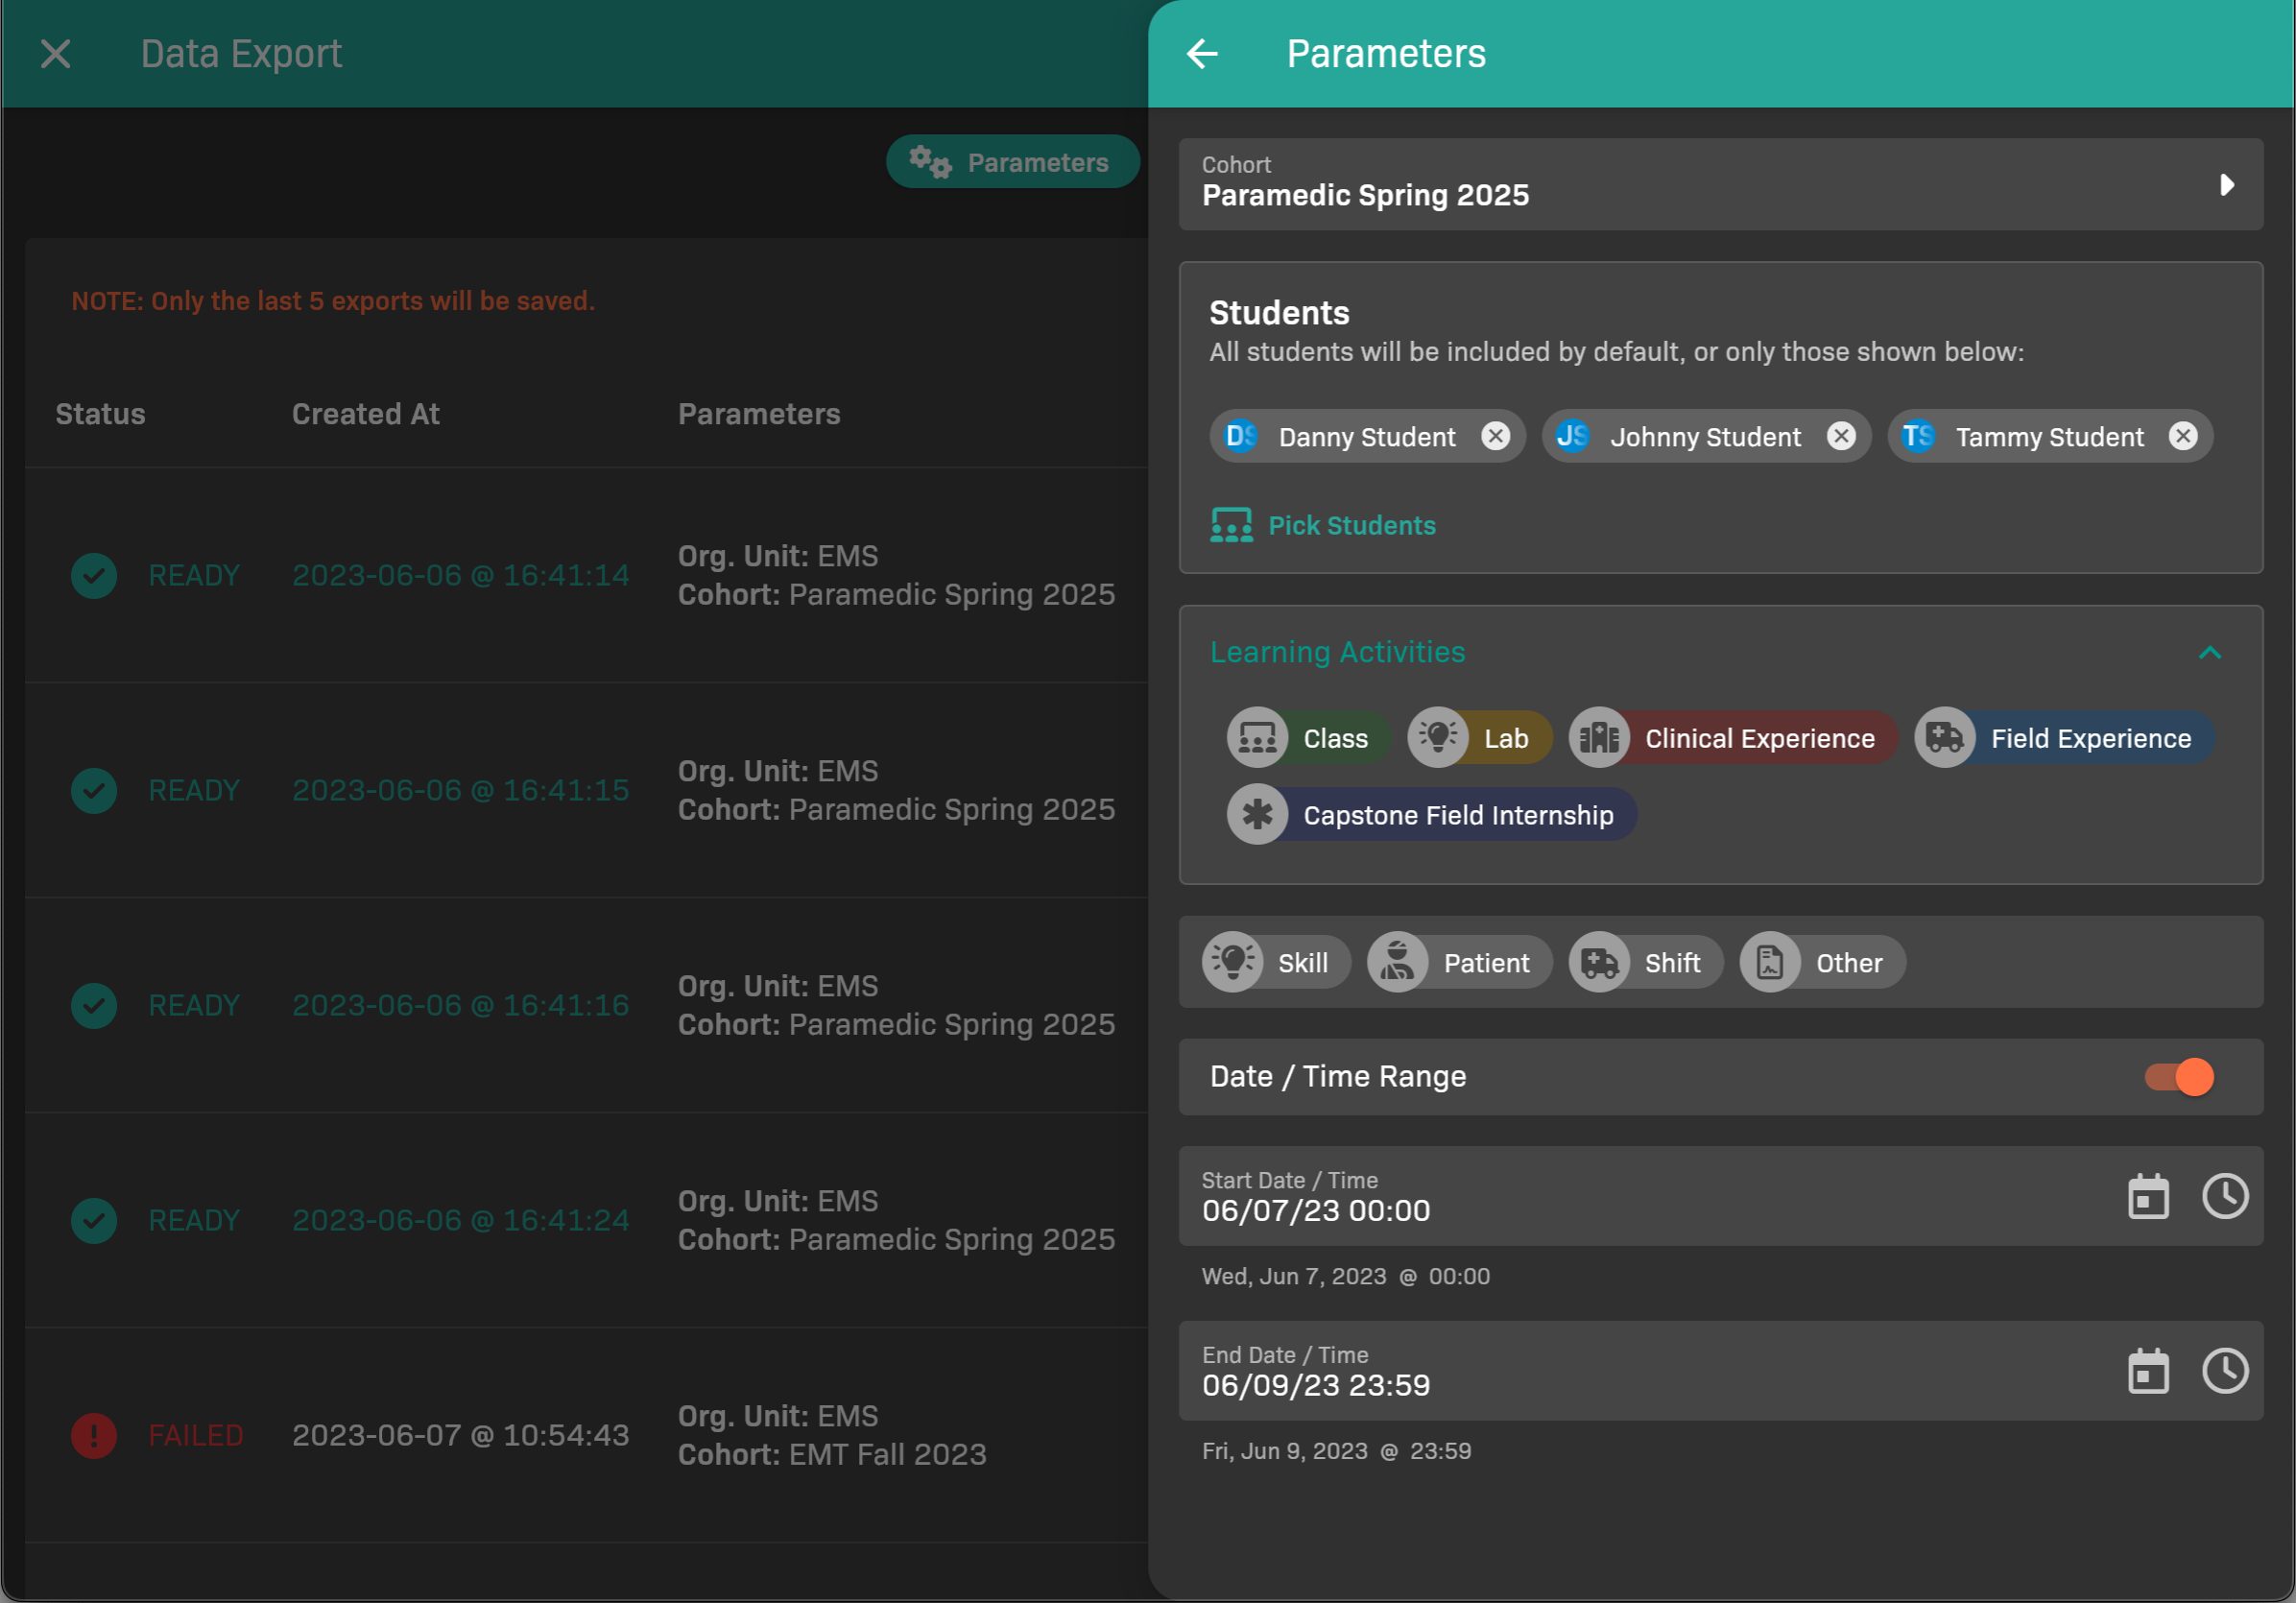
Data Export Parameters
- Change the Cohort, if needed.
- Select the Students to include; by default all students in the cohort are selected. Tap Pick Students to change selection.
- Select the Learning Activities to include.
- Select the evaluation type(s) to include (Skill, Patient, Shift, Other).
- To filter by when the evaluation occurred, enable Date / Time Range, then set Start and End.
- When you’re finished, tap .
-
Tap New Export.
Your export is generated in the background.
Step 2: Download the export when it’s ready
Section titled “Step 2: Download the export when it’s ready”When your export is ready, it appears in the list of exports on the Data Export page.
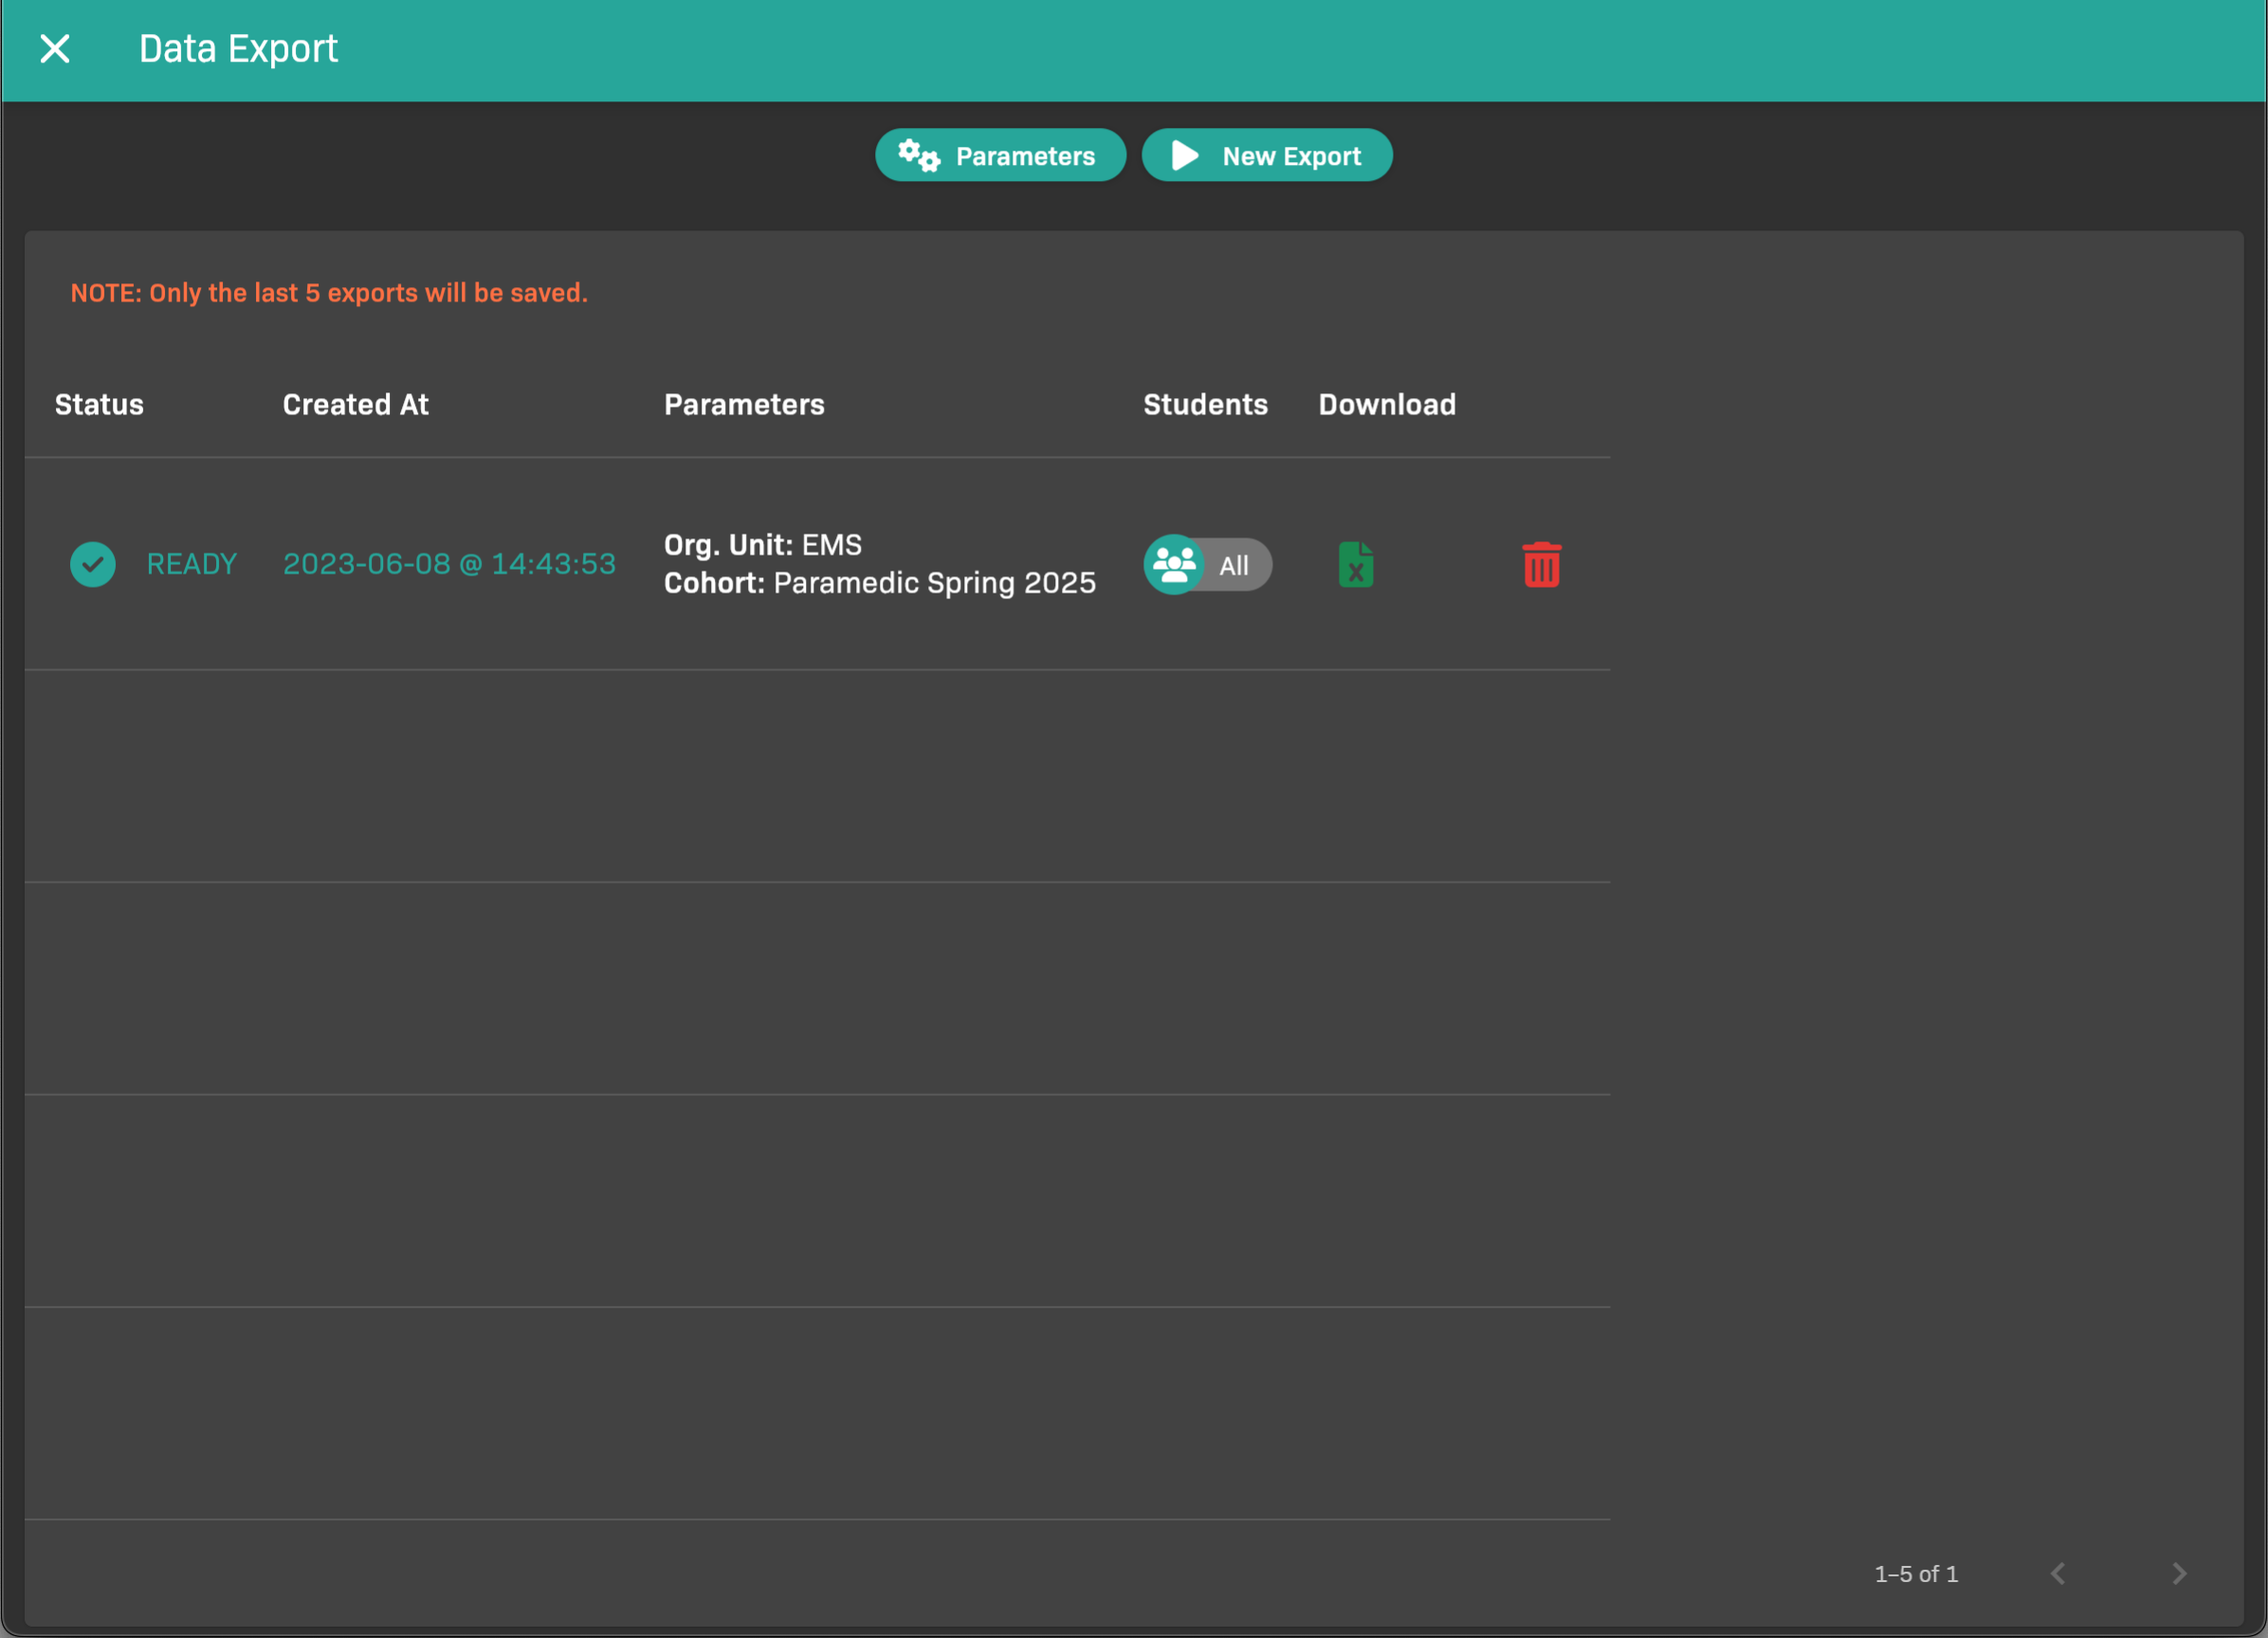
Completed Data Exports
To download a generated report, tap in the Download column.
Step 3: Customize in a spreadsheet application
Section titled “Step 3: Customize in a spreadsheet application”Use the spreadsheet application of your choice to open the file you downloaded in the previous step.